Population Pyramids
This Population has a steady rate because the population of the younger generations replace the older generation
This Population is also growing at a steady rate but once the 45-65 year old's die the population might decrease a bit because there would not be enough people to replace them
The Population of Denver is decreasing because the population of the younger ages can not replace the dying generations.
The population of New York City is has a steady population with a low increase.
The Population of Boston has a high amount 20-30 year old's that increase the population but once that age group dies then the population will decrease.
This population in increasing because the younger populations are big enough to replace the old that are dying and they have a large number of people left over.
Climate Outlook
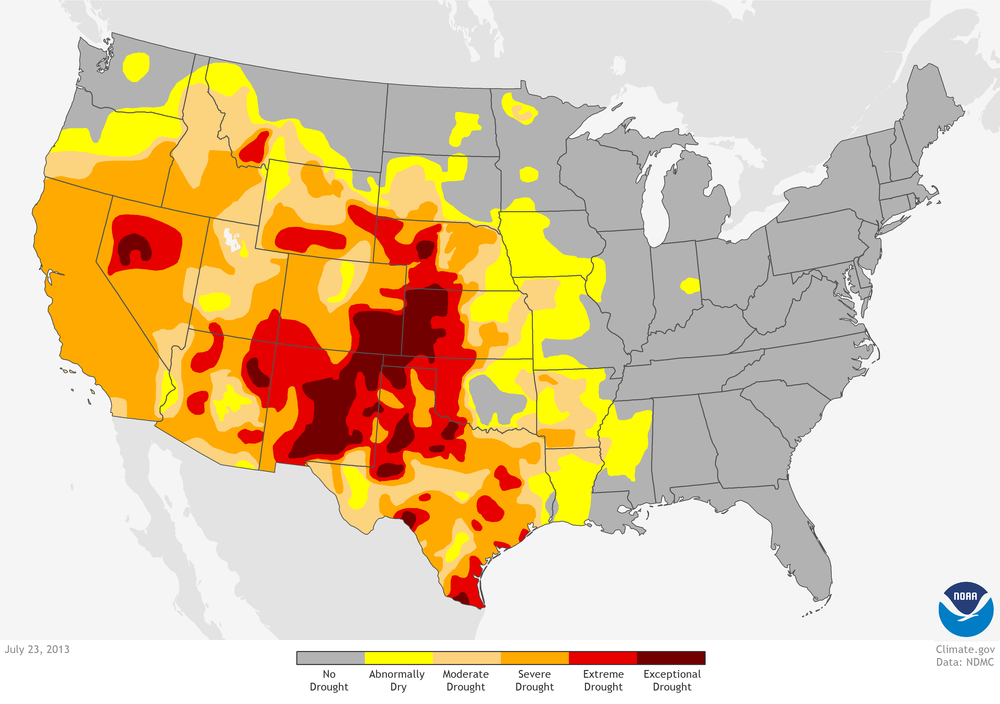
This map is showing California before the drought and it took 3 years and 6 months to clear all the red from the state.
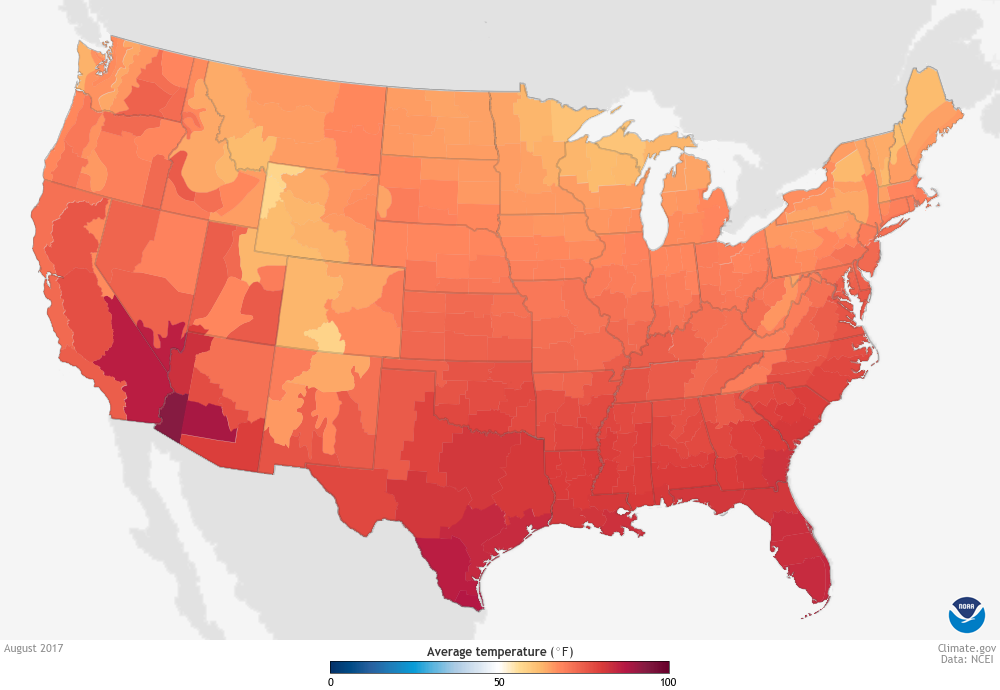
I find this map interesting because it shows that southern California is hotter than Nevada. I find this bizarre because Nevada is known to have a hot dry climate but research shows that the tip of California has a higher temperature.
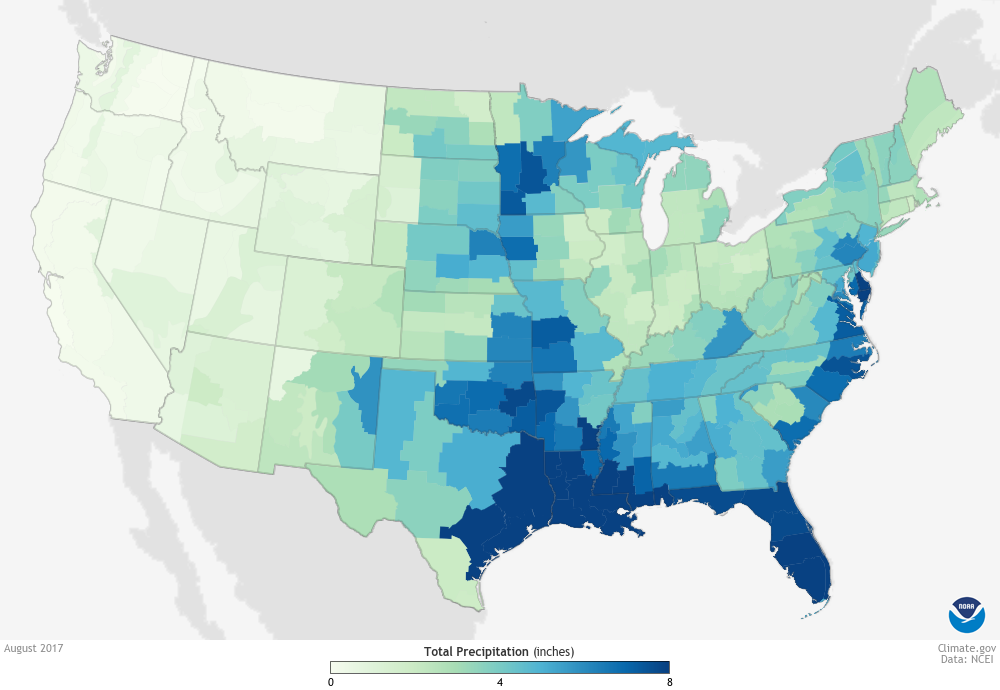
This map shows the monthly precipitation, looking at this month it shows how Florida and Texas are dark blue. This is because of the two hurricanes that hit those areas earlier this month. Hurricane Harvey and Irma both dropped about 20-30 inches of rain in just a couple days. This brought their total monthly precipitation up by a tremendous amount.
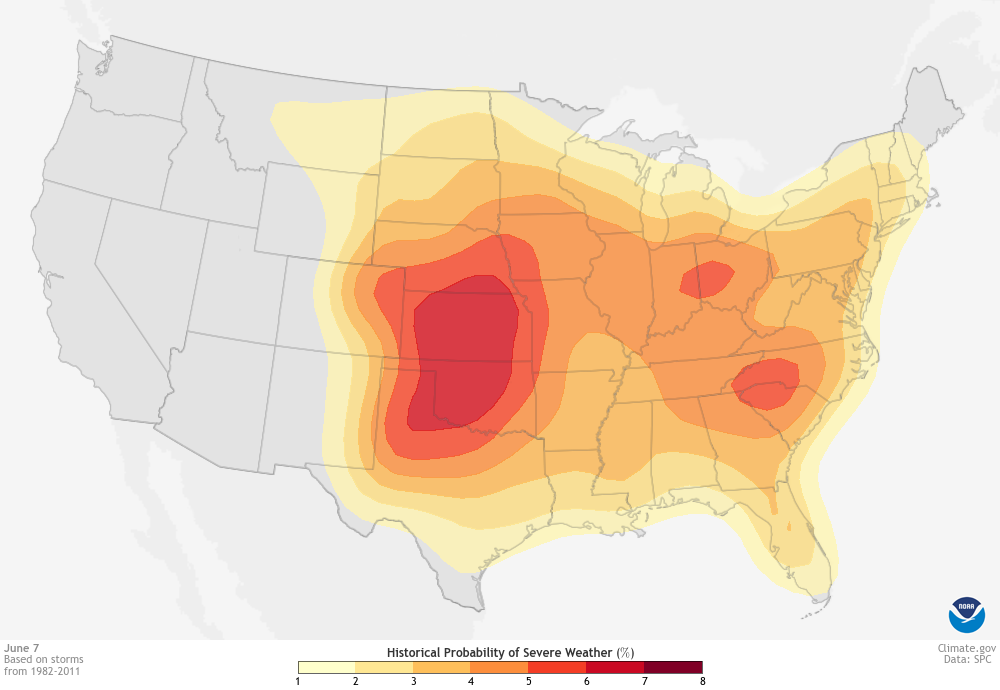
This map is showing the severe weather climatology and it shows that the month of June has the most severe weather out of the month. According to the graph the month of June has on average the most storms.

This map shows the surface temperature of the ocean in 2017. From the year 2000 the amount of orange which is the warmest temperature has increased dramatically .
1. Identify the parking lot that was the most diverse. Based on your observations during the lab, explain why your
prediction in question #1 of the prelab was supported or not supported.
The Student parking lot was more diverse. My prediction was supported because I hypothesized that the student parking lot would be more diverse.
2. List the single most abundant species in each set of data, and write a plausible explanation to explain why these are
the most abundant species.
In the Student parking lot the most abundant species was trucks and it was the same in the Staff parking. Trucks are the most abundant because we categorized all the truck brands together unlike the the cars which we grouped by brands.
3. Determine the maximum and minimum values for the Shannon Diversity Index in the parking lot you surveyed.
4. If you conducted this lab in a shopping mall parking lot, predict whether the Shannon Diversity Index would be high or
low, and how it would compare to the school parking lots.
5. If you conducted this lab at a new car dealership, predict whether the Shannon Diversity Index would be high or low,
and how it would compare to the school parking lots.
Wooly Worm Lab
1. The degree of freedom for this exercise is 6
2. The calculated chi-square value was 40.06 in this exercise
3. Our results indicate that it was not chance because our numbers are proven to be significant
4. The neutral colors worms have positive selection because they are more camouflaged in the grass and dirt but more vibrant colored worms were more susceptible to pray because they stand out.
5. This indicates that the worms with the positive selection will survive and pass on the traits that make the worms live longer.
6. The worms most susceptible to pray are brightly colored worms and the larger in size worms because they can be seen better by pray.
7. If the environment didn't change the population of worms would change to mostly string bean and olive garden because they are the most neutral colored and best fit for the land.
Photo used under Creative Commons from Giuseppe Milo (www.pixael.com)
